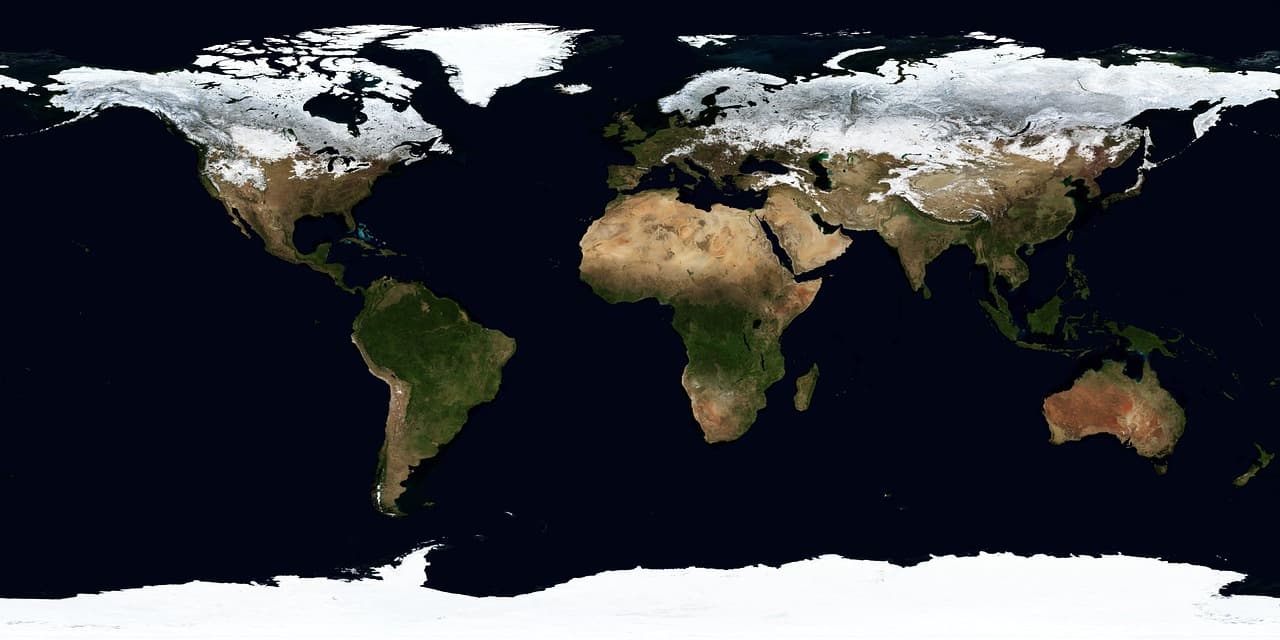
Google DeepMind and Google Research, together with the World Resources Institute (WRI) and the International Institute for Applied Systems Analysis (IIASA), have released Forest Typology (ForTy) 2020: a global map that classifies every 10×10 meter pixel on Earth into six forest and land‑use types. They also published an early annual time series covering 2017–2025 that tracks how those classifications change year by year, including cases where natural forest was converted into plantation or agricultural land.
Why distinguishing forest types matters
Most global maps indicate only whether trees are present. That is insufficient for conservation and regulation because ecological value and carbon storage depend heavily on an area’s history: a primary forest that has never been cleared holds much more carbon and biodiversity than a single‑species timber plantation that is harvested repeatedly. The European Union’s Deforestation Regulation (EUDR), for example, requires that certain commodities not originate from land that was forest in 2020 and later converted to agriculture. Similarly, wood products must not come from primary forests later converted to plantations or from naturally regenerating forests converted into plantations.
ForTy 2020 goes beyond presence/absence by identifying what kind of forest is present and — via the new time series — how that status evolved over time.
The six classes used by ForTy
ForTy uses FAO‑based definitions to assign pixels to six categories:
- Primary forest: native forest with no visible signs of human disturbance.
- Naturally regenerating forest: forest that regrew on its own after disturbance such as logging or fire.
- Planted forest: areas planted or seeded and managed over long cycles.
- Plantation forest: fast‑growing, intensively managed tree farms, often single‑species.
- Tree crops and agroforestry: farms growing non‑wood tree products such as oil palm, rubber, cocoa or fruit.
- Other land: everything else, including grassland, cropland, urban areas and water.
Model training and inputs
Because these categories depend partly on land use rather than appearance alone, training the model required a large, labeled dataset. The developers compiled about 1.7 million labeled locations from expert surveys, national and regional datasets, and targeted reviews where the model previously struggled. The model architecture is custom‑designed for remote sensing challenges and relies on AlphaEarth Foundations embeddings — compact summaries of years of satellite observations at each 10‑meter pixel — allowing the system to detect planting patterns, growth cycles and harvest rhythms.
Validation and reliability
With IIASA and WRI, ForTy was validated against more than 9,000 randomly chosen sites worldwide. At each site, two trained experts reviewed high‑resolution imagery and multi‑year satellite records to determine the true land type. ForTy identified the correct forest type 90% of the time and distinguished forest from non‑forest 95% of the time, outperforming other global forest maps.
Rather than providing only a binary label, the system outputs a probability score for each class, which lets users set region‑ or application‑specific thresholds. For example, a company assessing EUDR risk might accept only pixels with high model certainty to avoid regulatory exposure, while a researcher estimating total forest area could use the full probability distribution.
From a snapshot to a narrative of change
The released early time series covers each year from 2017 through 2025. It shows where forests were lost or gained and, crucially, what replaced or preceded them — for instance, a natural forest that was logged and replanted as a plantation, or abandoned land that slowly regenerated. This kind of distinction uncovers changes that standard tree‑cover maps can miss, because replanted land often appears green again even though its ecological character has changed.
Availability and next steps
Forest Typology 2020 and the 2017–2025 time series are freely available on Google Earth Engine under an open license. The authors hope governments, companies, conservation organizations and scientists will use these data to build deforestation‑free supply chains, direct forest finance where it is needed, and protect priority natural forests. The team plans ongoing improvements to the time series in collaboration with partners and users and welcomes feedback.
ForTy forms part of Google’s Earth AI and the broader “AI for Nature” research portfolio, which also includes mapping drivers of forest loss, forecasting deforestation risk, modelling global species distributions and monitoring biodiversity in the field.
Acknowledgements
The work was co‑developed by Google DeepMind and Google Research with the World Resources Institute and the International Institute for Applied Systems Analysis. Contributors and co‑authors include Anton Raichuk, Peter Potapov, Myroslava Lesiv, Matthew Overlan, Mélanie Rey, Ravindran Rajakumar, Michelangelo Conserva, Radost Stanimirova, Michelle Sims, Sarah Carter, Elizabeth Goldman, Yuchang Jiang, Linus Scheibenreif, Ivelina Georgieva, Maria Shchepashchenko, Steffen Fritz, Nicholas Clinton, Dan Morris and Drew Purves, as well as the trusted testers who helped improve the map.